|
| Place of Origin: | Japan |
| Brand Name: | Tamagawa |
| Certification: | CE |
| Model Number: | TS5210N54 |
| Minimum Order Quantity: | 1pcs |
|---|---|
| Packaging Details: | carton |
| Delivery Time: | in stock |
| Payment Terms: | T/T, Western Union, MoneyGram |
| Supply Ability: | 100pcs/week |
| TAMAGAWA: | TAMAGAWA | Material: | Iron |
|---|---|---|---|
| Color: | Black | Japan: | Japan |
| Temperature: | 20-90 | Dimension: | 80mm |
| Wire: | Wire | TS5210N54: | TS5210N54 |
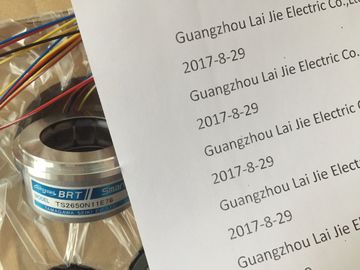
TS5210N54
| not change the program sequence. | You can modify the value for the tags in the online CPU to see how the user program responds. |
| It presents you with information about the program sequence and the data of the program in the CPU. |
You can force a peripheral output (such as Q0.1:P or "Start":P) to a specific value. |
| You can also use other functions to control the sequence and the data of the user program: |
You can enable outputs in STOP mode. Note |
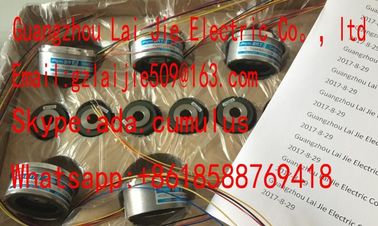
Guang Zhou Lai Jie Electric Co.,LTD
Please contact with “Tommy” for the price
TS5016N64
TS5017N60
TS5019N60
TS5420N60
TS5778N155
TS5013N68
TS5013N69
TS5208N131
TS5208N23
TS2025N471E69
TS2014N181E32
TS5208N111E78
TS5208N141E78
TS5631N224
PULSE
GENERATOR
RP-182
750PPR
PULSE
GENERATOR
RP-182
1500PPR
PULSE
GENERATORRP-482E,750PPR
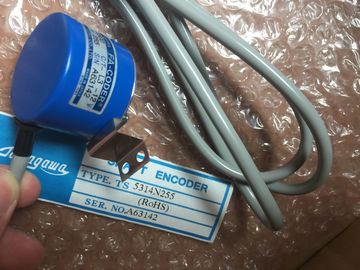
ROTALY
ENCODER
RP-112A-T1,750PPR
ROTALY
Always exercise caution when using control functions. These functions can seriously
influence the execution of the user/system program.
Table 14- 3 Online capabilities of the STEP 7 editors To monitor the tags, you must have an online connection to the CPU. Simply click the "Go
online" button in the toolbar.
When you have connected to the CPU, STEP 7 turns the headers of
the work areas orange.
The project tree displays a comparison of the offline project and the
online CPU. A green circle means that the CPU and the project are
synchronized, meaning that both have the same configuration and
user program.
Tag tables show the tags. Watch tables can also show the tags, as
well as direct addresses. The "Monitor value" field shows the value for each tag. You can monitor the status of the tags in the LAD and FBD program editors. Use the editor
bar to display the LAD editor. The editor bar allows you to change the view between the
open editors without having to open or close the editors.
In the toolbar of the program editor, click the "Monitoring on/off" button to display the status
of your user program. The network in the program editor displays power flow in green.
You can also right-click on the instruction or parameter to modify the value for the instruction. You can capture the current values being monitored in an online CPU to become the start
values for a global DB.
● You must have an online connection to the CPU.
● The CPU must be in RUN mode.
● You must have opened the DB in STEP 7.
Use the "Show a snapshot of the monitored values" button to capture the current
values of the selected tags in the DB. You can then copy these values into the "Start
value" column of the DB.
1. In the DB editor, click the "Monitor all tags" button. The "Monitor value" column displays
the current data values.
2. Click the "Show a snapshot of the monitored values" button to display the current values
in the "Snapshot" column.
3. Click the "Monitor all" button to stop monitoring the data in the CPU.
4. Copy a value in the "Snapshot" column for a tag.
– Select a value to be copied.
– Right-click the selected value to display the context menu.
– Select the "Copy" command.
5. Paste the copied value into the corresponding "Start value" column for the tag. (Rightclick
the cell and select "Paste" from the context menu.) Save the project to configure the copied values as the new start values for the DB.
7. Compile and download the DB to the CPU. The DB uses the new start values after the
CPU goes to RUN mode.
Note
The values that are shown in the "Monitor value" column are always copied from the
CPU. STEP 7 does not check whether all values come from the same scan cycle of the
CPU.A watch table allows you to perform monitoring and control functions on data points as the
CPU executes your program. These data points can be process image (I or Q), M, DB or
physical inputs (I_:P), depending on the monitor or control function. You cannot aurately
monitor the physical outputs (Q_:P) because the monitor function can only display the last
value written from Q memory and does not read the actual value from the physical outputs.
The monitoring function does not change the program sequence. It presents you with
information about the program sequence and the data of the program in the CPU.
Control functions enable the user to control the sequence and the data of the program.
Caution must be exercised when using control functions. These functions can seriously
influence the execution of the user/system program. The three control functions are Modify,
Force and Enable Outputs in STOP.
With the watch table, you can perform the follog online functions:
● Monitoring the status of the tags
● Modifying values for the individual tags
You select when to monitor or modify the tag:
● Beginning of scan cycle: Reads or writes the value at the beginning of the scan cycle
● End of scan cycle: Reads or writes the value at the end of the scan cycle
● Switch to stop To create a watch table:
1. Double-click "Add new watch table" to open a new
watch table.
2. Enter the tag name to add a tag to the watch table.
The follog options are available for monitoring tags:
Monitor all: This command starts the monitoring of
the visible tags in the active watch table.